class: center, middle, inverse, title-slide .title[ # Causal Inference ] .author[ ### Keith McNulty ] --- class: left, middle, r-logo ## SAT Scores and Family Income 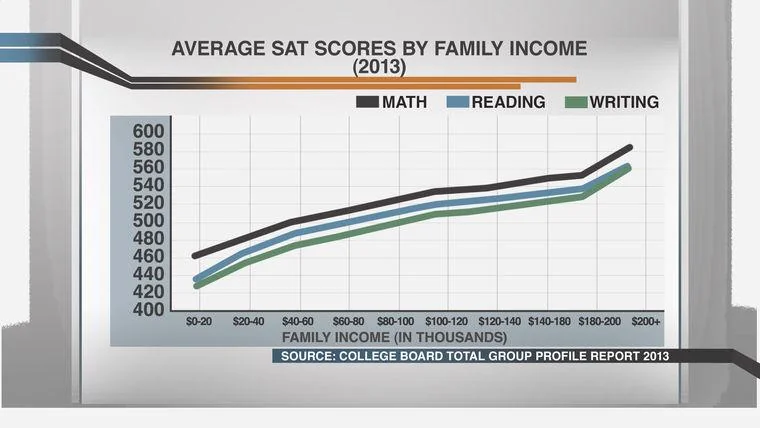 --- class: left, middle, r-logo ## Waffle Houses and Divorce Rates in US states <img src="index_files/figure-html/unnamed-chunk-1-1.png" alt="" style="display: block; margin: auto;" /> --- class: left, middle, r-logo ## What is causal inference? Here are two common reasons why we construct statistical models on samples of data: 1. To try to make accurate out of sample predictions (*Predictive Modeling*) 2. To try to explain a phenomenon by inferring causality from the sample (*Inferential Modeling*) How we approach these two objectives can be very different in practice. **Causal Inference** is the science of inferring causality from statistical models. It is a very disciplined approach to inferential modeling, focused on the avoidance of 'booby traps' in causal logic. --- class: left, middle, r-logo ## How do we conceptually represent causality? Causality (or our beliefs around causality) can be represented by a **directed acyclic graph** or **DAG**. Directed, because causality is always in a certain direction, and acyclic because we don't imagine that a cause causes itself. Here's a simple example: imagine you work for *McDonalds*. Let `\(R\)` be your hourly pay rate, let `\(H\)` be how many hours you work in the week, and let `\(P\)` be your weekly total pay. Then we can create the following simple DAG to represent the causes of `\(P\)`: <img src="index_files/figure-html/unnamed-chunk-2-1.png" alt="" height="300" style="display: block; margin: auto;" /> --- class: left, middle, r-logo ## Which DAG is a more believable explanation of the Waffle House phenomenon? In these DAGs, a circled variable means a variable which is as yet unknown/unobserved. <img src="index_files/figure-html/unnamed-chunk-3-1.png" alt="" width="50%" /><img src="index_files/figure-html/unnamed-chunk-3-2.png" alt="" width="50%" /> --- class: left, middle, r-logo ## Statistical models and causal theories We can use statistical models to lend support to our theories of causality. Though models can never prove a causal relationship, they can show that certain variables influence an outcome, which can support a theoretical causal model under the right conditions. However, there is a really big difference between these two things: 1. Showing that a variable has an observed *association* with an outcome (this is simply a correlation) 2. Generating statistical support for a theory that a variable may have a *causal influence* on an outcome (this requires more than a correlation). --- class: left, middle, r-logo ## Booby trap 1: The Fork (Collinearity) In a DAG, we only draw an arrow between two variables when we believe there to be an **independent** causal influence between two variables. Variables can still be associated even though they are not connected in a DAG. Imagine we are trying to understand the causal influence of a state being in the south (`\(S\)`) and the number of Waffle Houses (`\(W\)`) and Divorce Rates (`\(D\)`). We construct the following DAG based on our belief around causality: <img src="index_files/figure-html/unnamed-chunk-4-1.png" alt="" height="300" style="display: block; margin: auto;" /> --- class: left, middle, r-logo ## Booby trap 2: The Pipe (Post-treatment bias) Sometimes a variable will have a causal influence on another variable through a mediator variable. For example, Southern States (`\(S\)`) tend to have lower marriage ages (`\(A\)`), and lower marriage ages (`\(A\)`) tends to increase divorce rates (`\(D\)`). So we might construct the following DAG: <img src="index_files/figure-html/unnamed-chunk-5-1.png" alt="" height="300" style="display: block; margin: auto;" /> --- class: left, middle, r-logo ## Sometimes, conditioning on a third variable can result in false inferences <img src="index_files/figure-html/unnamed-chunk-7-1.png" alt="" height="500" style="display: block; margin: auto;" /> --- class: left, middle, r-logo ## Booby trap 3: The Collider Our enthusiastic analyst might conclude that they have support for a causal relationship between `\(P\)` and `\(I\)`, but this is only because they have conditioned on `\(H\)` by only analyzing employees who have been hired. <img src="index_files/figure-html/unnamed-chunk-8-1.png" alt="" height="400" style="display: block; margin: auto;" /> --- class: left, middle, r-logo ## The backdoor criterion Given any DAG, and given any two variables which we are trying to causally relate, we can follow a simple process to determine what to include in our causal model. Let `\(A\)` be our input (cause) variable and `\(B\)` be our outcome (effect) variable. Follow these steps to determine what additional variables to include in your causal model: 1. List all (undirected) paths from `\(A\)` to `\(B\)`. 2. Consider a path closed if it contains a collider. Otherwise consider it open. 3. Determine if any open paths have an arrow pointing to `\(A\)`. This is called a **backdoor path**. 4. Select variables to condition on in order to close those open backdoor paths. 5. Include these variables in addition to `\(A\)` and `\(B\)` in your model. --- class: left, middle, r-logo ## Fun exercise: Divorce, Waffles and 'Southern-ness' We are now going to propose a wider DAG to try to support causality of divorce rates `\(D\)` in US states. In addition to average age at marriage `\(A\)`, marriage rate `\(M\)`, and number of Waffle Houses `\(W\)`, we are now going to introduce the 'Southern-ness' of states `\(S\)` as a binary variable (in case all y'all don't know, a state is either a Southern state or it is not!). Here is our proposed DAG: <img src="index_files/figure-html/unnamed-chunk-9-1.png" alt="" height="300" style="display: block; margin: auto;" /> --- class: left, middle, r-logo ## Class exercise What variables should we condition on if we want to support: 1. Waffle Houses as a cause of divorce rates 2. Southern-ness as a cause of divorce rates --- class: left, middle, r-logo ## Is there support for Waffle Houses causing divorce? <img src="index_files/figure-html/unnamed-chunk-10-1.png" alt="" style="display: block; margin: auto;" /> --- class: left, middle, r-logo ## Now the 'Southern-ness' question <img src="index_files/figure-html/unnamed-chunk-11-1.png" alt="" height="500" style="display: block; margin: auto;" /> --- class: left, middle, r-logo ## Digital Swag 1. Chapter 15 of "Handbook of Regression Modeling in People Analytics" (2026) by Keith McNulty 2. Richard McElreath's *Statistical Rethinking* YouTube lecture series.